CRACK TIP DISPLACEMENT AND THE FRACTURE PROCESS
By
Dr. P. F. Packman
Professor Emeritus, Department of Mechanical Engineering
Southern Methodist University
Dallas TX 75275
Abstract
Optical interferometry was used to determine the profile shapes of cleavage cracks in small specimens of MgO single crystals. From the values of the displacements measurements, a third order polynomial expression was developed for each crack. Using the zero order constant the crack opening displacement at the tip of the crack was extrapolated under zero load and under different applied loads. The value of the extrapolated crack tip displacement was estimated to be about 1552 Angstroms with a standard deviation of 222 Angstroms. This no load COD was independent of crack length, specimen width and specimen thickness. The extrapolated value of COD at the maximum load was estimated to be 2167 Angstroms with a standard deviation of 213 Angstroms. The maximum COD immediately prior to crack propagation was independent of crack length, specimen width and thickness. Any increase in displacement due to increasing load results in propagation of the crack. A stress of about E/10 in the material immediately ahead of the crack tip was calculated using the displacement at the crack tip immediately prior to failure and elastic notch stress theory. This stress is on the order of magnitude of the theoretical strength required to fracture atomic bonds.
Introduction and Background
A number of approaches have been developed to the problem of brittle fracture in solids. These include a variety of stress approaches where a local critical stress exceeds a material property such as ultimate strength, shear strength, von Mises strength etc. Another approach has been to consider local strain energy, a combination of stress and strain or strain energy released by the propagation of the crack compared to the energy required to create new crack surfaces. Each of these has been used in engineering applications.
The most commonly accepted fracture criterion is that using the concept of a maximum stress intensity factor associated with the stress distribution in the material at the immediate tip of the crack. This is a modified Griffith strain energy approach, as modified and expanded by Irwin using Westergaard analysis for the stress distribution around the tip of a crack. The presence of a crack in a material under load significantly modifies the local stress state near the vicinity of the crack. The local stresses in the vicinity of the crack tip are given by a set of equations of the form
![]()
Where,
σy is the local stress in the y direction,
r is the radial distance from the tip of the crack,
θ is the angle from the plane of the crack, and
K is the stress intensity factor given by
![]()
With
σapp the gross stress applied far from the crack,
a is a measure of the length of the crack for a center crack of length 2a,
and α is a term relating the geometry of the specimen containing the crack as well as any corrections for plasticity.
The material is assumed to fail when the local stress σy at a fixed position in the immediate vicinity of the crack tip ( r and θ constant) reaches some critical value. For a fixed geometry of the crack, the value of K increases with increasing load until a critical value KI is reached.
Hence at failure
![]()
Where
σf is the gross stress at failure, and
Kc is the critical value of stress intensity.
This is the principal equation for linear elastic fracture mechanics.
Several assumptions are incorporated in this analysis:
1. The local stresses remain elastic up to the point of failure. The local plasticity caused by the crack tip stresses are either not considered or the changes in the elastic stress distribution associated with the crack tip plasticity are assumed to be small compared to the length of the crack.
2. The crack length, a, remains fixed until the instant of failure. There is no slow or stable tearing at the front of the crack to increase the crack length.
3.
The infinite local stresses in the immediate region at the tip of the crack
as r ![]() 0
are not considered.
0
are not considered.
4. The local stress field in the region ahead of the crack tip is described adequately by the elastic stress field equations.
5. The geometric factors associated with the shape of the crack and the geometry of the component containing the crack are accounted for by the α term in the equation.
6. The plasticity factors can be accounted for by the α term.
7. The value of critical stress intensity at failure Kc at failure is a constant, and adequately describes the criterion for failure.
The adequacy and validity of these assumptions is the basis for the study of fracture mechanics in the linear elastic region of failure and is the basis for linear elastic fracture mechanics (LEFM). LEFM has seen great success in engineering applications over the past decade. It has become one of the major design procedures used by engineers in the prevention of catastrophic fracture. Extension of LEFM into elastic-plastic fracture using plasticity corrections, J integral elastic plastic analysis and other concepts have been used in a wide range of design procedures ranging from aerospace to bridges to nuclear and pressure vessel design. The concepts of linear elastic fracture mechanics applied initially by Paul Paris to fatigue crack growth have probably achieved even more success and are considered to be fundamental to the design of component under fatigue loading conditions. Fracture mechanics analysis for predicting failure and fatigue crack growth for predicting cycles to grow the crack from small sizes to a size that would cause overload failure were first combined by Packman et al. with quantitative non-destructive inspection analysis to produce the FM-NDT design procedure widely used today. Using the concept that the initial flaw size was one that could just be reliably detected by NDT, and using FM fatigue growth to predict the onset of fracture allowed reliable estimates of inspection and overhaul times to be determined for critical structures, particularly commercial and military aircraft. The FM-NDT design process has become standard for FAA approval of commercial aircraft, and required for general and military aircraft as well as a wide spectrum of critical designs involving bridges, automobiles, helicopters, pressure vessels, heart valves etc. etc.
Despite the success of fracture mechanics as an engineering approach to fracture design, a number of fundamental questions regarding the nature of the fracture process remain unanswered. The most difficult problem is the nature of the process associated with the material under high stress at the tip of the crack. It is well recognized that in order to break atomic bonds or to shear the material on an atomic scale, the local stresses must be on the order of magnitude of the E/3 to E/10 –E/30. Where E is the elastic modulus of the material. However local plasticity associated with the material ahead of the crack tip under loads produces plastic deformation that rapidly reduces the immediate stress in the material at the crack tip to the magnitude of the gross yield stress σty which is at maximum an order of magnitude (or more) less than the stress required to fail material at an atomic level. Some localized mechanism is required to raise the stress from the gross yield to a magnitude that can fail atomic bonds.
The
elastic stress field used by linear elastic fracture mechanics assumes a
mathematically sharp crack tip. The major difficulty in using this
approach is that there is an infinite stress singularity at the immediate
tip of the crack, i.e. as r→0, σ→∞. To surmount this problem, the
concept of a material property called the critical stress intensity
parameter Kc was introduced. The stress intensity has the
dimensions of stress times a square root distance ksi![]() ,
which appears to be a normalized stress measured over a critical distance
from the tip of the crack. When the stress intensity reached a
critical value Kc, as measured in laboratory tests to failure of
identical materials, the part is considered to have failed. The Kc
thus obtained was considered a material property. This overly
simplified approach was rapidly shown to require significant modification;
the value of Kc was shown the depend on thickness of the
material containing the crack, the direction of the displacement of the
adjacent crack faces produced by loading, as well as the plastic zone in the
material ahead of the crack tip as developed by the fatigue stresses used to
produce the crack. These problems were solved by using a lower bound
opening mode value determined from sufficiently thick specimens containing a
through crack to produce a plane strain stress distribution for a major
portion of the crack tip face.
,
which appears to be a normalized stress measured over a critical distance
from the tip of the crack. When the stress intensity reached a
critical value Kc, as measured in laboratory tests to failure of
identical materials, the part is considered to have failed. The Kc
thus obtained was considered a material property. This overly
simplified approach was rapidly shown to require significant modification;
the value of Kc was shown the depend on thickness of the
material containing the crack, the direction of the displacement of the
adjacent crack faces produced by loading, as well as the plastic zone in the
material ahead of the crack tip as developed by the fatigue stresses used to
produce the crack. These problems were solved by using a lower bound
opening mode value determined from sufficiently thick specimens containing a
through crack to produce a plane strain stress distribution for a major
portion of the crack tip face.
All engineering theories of fracture bypass the problem of the localized stresses in the material ahead of the crack tip at the time of crack propagation. Fracture mechanics ignores the infinite stress singularity by referencing a stress intensity, which is a normalized stress in the material averaged over a distance. The continuum theories, i.e. von Mises or maximum principal stress theories reference only gross engineering properties such as ultimate stress. The J integral modeling of the crack and strain energy density models use either the localized stress intensity or elastic strain energy associated with a line integral containing a finite amount of material around the tip of the crack. Most of these engineering theories require bypassing the local stresses immediately ahead of the crack because the localized plastic deformation in the material ahead of the crack tip does average out the localized stresses above the yield or deformation stress. For a ductile material, the problem becomes:” How does the localized stress increase from the gross yield stress of the material to a stress sufficiently high to break local atomic bonds and cause the crack to propagate?” Some localized crack tip process of deformation or strain rate must limit the plastic deformation and the “back stresses” are increased sufficiently to cause fracture.
The purpose of these experiments was to determine the local stresses in a material immediately in front of a cleavage crack in a brittle material. This bypasses the problem of the localized plastic deformation at the crack tip. While there remains some plastic deformation, it is minimal, even on an atomic scale. This is the same rationale used in linear elastic fracture mechanics where the plastic zone is assumed a small percentage of the crack length. In this case, however, the local stress can be estimated directly using continuum elastic methods multiplying the gross applied stress by the geometric elastic stress concentration factor – a common practice in engineering design.
To fracture the material directly ahead of the crack resulting in crack propagation requires that the local stresses be on the order of the cleavage stress in the material. Using elementary analysis developed by Friedel (1959) and Griffith (1920) these local stresses should approach the magnitudes between E/3 to E/30 where E is the elastic modulus. By measuring the crack tip displacements and considering the crack to be an extremely sharp notch one can estimate the localized stress concentration factor associated with the crack under load. Using the gross applied stress calculated by assuming the cracked body to be a cantilever beam loaded at the free end, the gross stress in the material can b estimated. This when multiplied by the stress concentration due to the crack tip geometry should estimate the local stresses in the material immediately prior to crack propagation. These local stresses should approach the theoretical stress required to break bonds.
Experimental Program
Small test specimens of magnesium oxide, MgO, were cleaved from larger blocks approximately 1.0x.5x.2 inches. The smaller test specimens were produced by further cleavage and were approximately 0.75 x 0.2 x 0.2 inches, (19.2 x x mm) . These smaller specimens were epoxy mounted in a loading fixture consisting of a mount for the crystal and a single edge razor blade mounted on a micrometer. The crystals were loaded by pushing the razor blade into the crystal with the micrometer. The experimental loading fixture was small enough to fit under the lens of a low magnification binocular microscope. The loading fixture is shown in Figure 1. The cleavage cracks were further loaded until the crack propagated. Figure 2 shows a cleavage crack in an MgO sample prior to mounting in the loading fixture.
During the loading process, the loading fixture containing the cleavage cracks were mounted on the stage of a binocular microscope and viewed under monochromatic sodium wavelength light. The microscope was focused on the crack plane. The two faces of the cleavage cracks when viewed under the monochromatic light produced interference patterns that could be used to determine the displacement of the two faces of the crack at known distances back from the tip of the crack. Figure 3 shows a typical collage of crack interference patterns constructed using a series of photographs taken using a sodium vapor light source. The crack tip front is located at the top of the photograph.
Interference bands are produced by the destructive interference of the reflected monochromatic sodium light from the two faces of the crack faces. Constructive interference occurs when the light reflected from the top crack face is reinforced by the light reflected from the bottom crack face. The constructive reinforcement occurs when twice the distance between the crack faces (top and bottom) is equal to an integer number of wavelengths, i.e. when
![]()
The number of the band from the crack front is the order of the reflection. Between each constructive reinforcement is a dark band of the destructive reinforcement. The destructive reinforcement occurs when the light reflected from the top face is out of phase with the light reflected from the bottom crack face. This occurs when twice the distance between the cracks is half a wavelength out of phase and occurs between the constructive reinforcements. Hence
![]()
.
Here n is the order of the dark fringe, the number of fringes from the crack tip, and λ is the wavelength of the sodium light 5280 Ä. The first dark fringe occurs at a distance of
δ = (0.5)5980Ä/2 = 1495Ä.
The second and subsequent dark fringes occur at 1.5λ, 2.5λ, 3.5λ etc. In this manner the shape of the space comprising the opening displacements of the crack can be profiled.
The equation for the shape of the crack displacements is estimated using and Excel© spreadsheet using a 3rd or fourth order polynomial.
![]()
The value of the ao is the intercept at x = 0 and is the extrapolated value of the crack tip opening displacement. The Excel© program also gives the value of R2 which is an estimate of the goodness of fit of the polynomial to the data. Most of the fits had R2 values of 0.99 or better. Some fits resulted in R2 =1 indicating an excellent fit.
Figure 4 shows a typical EXCEL© graph constructed using the fringe order at the Y-axis and the measured distance from the back of the crack tip as the x-axis. The polynomial fit for this crack opening is given in the figure as well as the goodness of fit, in this case R2 = .9999. The extrapolated value of crack opening displacement for this specimen is 0.499.
Using the loading fixture, the crack was loaded until the crack propagated. Under increasing loads, the fringes move gradually toward the crack tip, indicating that the crack is slowly opening. Figure 5 shows a series of interference patterns taken from a loaded cracked specimen under increasing loads. The movement of the fringes is barely discernable. For other specimens the movement was more readily apparent, and Figure 6 shows a series of fringe order vs. distance from the crack tip for a specimen loaded under five different increasing loads. The changes in the crack shape are apparent. Unfortunately, this specimen fractured immediately after the last load was applied.
The shape of the crack opening surfaces was treated as if one crack surface was flat and the other crack surface did all of the deformation. This is realistic since the lower portion of the MgO crystal containing the cleavage crack was firmly glued to the bottom of the loading fixture precluding any downward displacement. When the upper portion of the cleavage crack material is considered as a cantilever beam with a single point load at the free end, the magnitude of the loading of the cantilever can be used to determine the local (beam) stress at the fixed end of the loaded beam.
Using standard classical strength of materials Timoshenko (1934) the deflection curve is given by
![]()
Here
P is the applied load
E is the elastic modulus
I is the moment of inertia of the beam ![]() with
length L and height t and width w.
with
length L and height t and width w.
L is the length of the beam
And
X is the distance back from the crack tip.
The load causing deflection δ of a crack of length a is given by
![]()
X is now measured from the crack tip.
Gilman (1958) and Westwood (1963) have made similar analysis of cracks specimens.
The local stress at the tip of the tip is calculated using standard beam analysis.
The local stress is given by the gross beam loading stress multiplied by the localized stress concentration. The stress concentration factor is given by
![]()
Where a is the depth of the geometric stress concentration (in this case the length of the crack a)
And
ρ is the radius at the base of the geometric stress concentration. In this case, the radius is assumed to be half of the extrapolated crack opening displacement.
For high values of stress concentrations, i.e. sharp crack the term under the square root is significantly higher than 1. For this reason the stress concentration factor is given by
![]()
The local stress at the tip of the crack is then given as
Results and Discussion of Results
The optical interference patterns developed by the crack opening were photographed using a monochromatic sodium light source. Typical results are shown in Figures 3 and 5. The location of the crack tip is easily identified. Starting with the first fringe, the distance from the crack tip to the center of the dark fringe is measured. The photographs were taken at a uniform magnification of 48X for the Vanderbilt tests and 50X for the SMU tests. Approximately 6-12 photos were required for each specimen series. Each subsequent dark fringe is considered a unit increase in fringe order. Using a standard EXCEL© plotting routine, typical results for the fringe order vs. the distance back from the crack tip were plotted. A number of curves were then constructed for each specimen under zero load. A typical plot is shown in Figure 6. Using the EXCEL© curve fitting routine, a polynomial fit for the size of the no load crack opening was calculated. This was considered the COD (crack opening displacement) at zero load. Table I lists the variation in no load COD measured from the extrapolation.
TABLE I
NO LOAD COD AND MAX COD
FOR MgO SPECIMENS (COMPILED)
|
SPECIMEN NUMBER |
NO LOAD COD |
MAX COD |
SPECIMEN NUMBER |
NO LOAD COD |
MAX COD |
|
1 |
1150 |
1850 |
10 |
1250 |
2010 |
|
2 |
1210 |
2200 |
11 |
1700 |
2210 |
|
3 |
1550 |
2060 |
12 |
1820 |
2390 |
|
4 |
1210 |
1820 |
13 |
1600 |
2150 |
|
5 |
1900 |
2450 |
14 |
1700 |
2650 |
|
6 |
1450 |
1930 |
15 |
1550 |
2190 |
|
7 |
1550 |
2060 |
16 |
1800 |
2250 |
|
8 |
1600 |
2100 |
17 |
1750 |
2350 |
|
9 |
1520 |
1980 |
18 |
1600 |
2290 |
The no load COD has a mean of 1552 Angstroms with a standard deviation of 222 Angstroms. It is a variation of approximately ±14%. Comparing the no load COD as a function of length shows that the COD no load is independent of the length of the crack. However if the crack tip approaches the vertical free end of the specimen, i.e. the amount of uncracked ligament is small, a relatively large amount of plastic deformation occurs as an interaction of the dislocations emanating from the crack tip and the free surface. These COD specimens were discarded.
The COD measured prior to fracture is more difficult to estimate. If the part is loaded too far, the crack propagates and the measurements of the crack length and the polynomial fit for the extrapolated no load COD and the final load COD must be recalculated. If the crack propagates too far, there is insufficient material ahead of the crack and the specimen is ruined. The loaded measurements of COD are estimates made at a load below the load required to propagate the crack. A slight turn of the micrometer screw propagates the crack. The COD at a load estimated to be close to fracture is also tabulated in Table I. The average value of maximum COD was estimated as 2167 Angstroms with a standard deviation of 213 Angstroms. This amounts to about 10% variation in maximum COD. The maximum value of COD was compared as a function of crack length. It too appeared to be independent of specimen geometry such as crack length, width and thickness.
One series of photographs at a maximum load were evaluated for any variations in maxim COD across the crack front. While there were some slight variations it was concluded that for sharp brittle materials such as MgO, there does not appear to be COD variations as a function of thickness. In a more ductile material such as PMMC, one would expect variations in COD as the crack front transitions from plane stress at the free faces (edges) to the plane strain loading conditions at the center of the crack.
The size of the plastic zone ahead of a crack under
load in a semi-ductile material is related to the magnitude of the COD; i.e.
more plasticity more crack opening. The plastic zone for plane stress
at the free edges of a crack would be  .
The applied stress is the same at the center and the edge of the crack, the
yield stress is constant. The plastic zone for the plane strain in the
center of the crack would be
.
The applied stress is the same at the center and the edge of the crack, the
yield stress is constant. The plastic zone for the plane strain in the
center of the crack would be  .
The crack opening displacement is usually estimated as COD =
.
The crack opening displacement is usually estimated as COD =![]() i.e. proportional to the plastic zone times the strain at yield. Since
there is no significant difference from the center to the edges of the
crack, it appears that MgO is brittle enough that plane strain conditions
prevail across the whole front of the crack tip.
i.e. proportional to the plastic zone times the strain at yield. Since
there is no significant difference from the center to the edges of the
crack, it appears that MgO is brittle enough that plane strain conditions
prevail across the whole front of the crack tip.
Williams and Swerlow (1967) developed an early model in which they showed that the crack displacement varies linearly with the applied stress. Their analysis indicated that
![]()
Here
V is the elastic displacement a the crack tip,
a is the crack length,
E is the elastic modulus, and
σ is the applied stress.
Figure 7 shows the measurement of COD as a function of applied load. (Extrapolated fringe order increase vs. arbitrary loading values associated with the change in micrometer screw position.) It can be seen that the increase in COD measured using this approximate system appears to be linear with increasing load.
Calculating the stress applied to the cracked specimen required to cause fracture required several steps. First, the applied load at the free end of the cracked specimen was determined. To determine this applied load P, a specific fringe was selected. Measuring the distance back from the crack tip and counting the fringe number resulted in the beam displacement at a given distance from the fixed cantilever. These values were introduced into the cantilever load deflection curve
![]()
Using the value of the applied load and the beam stress equation, the stress in the beam at the fixed end, i.e. the crack tip immediately prior to crack propagation was estimated.
Using the geometric length of the crack a as the depth of the stress concentration factor and the COD at that maximum load as twice the radius, ρ, of the tip of the stress concentration an estimate was made of the stress concentration factor Kt .
![]()
The values of stress concentration factor varied from 250 to 400. This variation is not due to the variations in COD, but appears to be as a result of the different crack lengths. Obviously, the longer crack failed at lower applied loads.
The resulting maximum stress immediately prior to failure was estimated by multiplying the stress in the beam at the fixed end times the stress concentration factor.
The estimates for the maximum stress indicated an average value immediately prior to fracture as 5 x 10⁶ psi. The theoretical strength could vary from E/3 = 12 x 106 psi. The results are only estimates, but still in the relative order of magnitude. More accurate estimates of stress would require a better fit to the cantilever beam equations and a more accurate estimate of the stress at the fixed end of the cantilever beam. The most significant factor causing error was the fact that the cantilever beam equations assume zero slope at the fixed end of the beam. In the case of the fringe order analysis it was shown that the slope of the cracked specimen was not zero, but in fact was finite and in many cases varied as the cracked specimen was loaded.
Conclusions
As a result of the experiments conducted initially at Vanderbilt University and later at SMU in Dallas, the following conclusions can be drawn.
1. The cracks produced at Vanderbilt University and later at SMU in the MgO samples were almost identical in shape and form
2. The shape of the crack close to the crack tip appears to be smooth curve up to the limits of experimental measurements.
3. The smooth shape of the crack justifies the extrapolation of the last measurement to the values of crack opening displacement COD at the crack tip.
4. The no load extrapolated crack tip COD was estimated to be about 1552 Angstroms with a standard deviation of 222 Angstroms.
5. This no load COD was independent of crack length, specimen width and specimen thickness.
6. The extrapolated value of COD at the maximum load was estimated to be 2167 Angstroms with a standard deviation of 213 Angstroms.
7. The maximum COD immediately prior to crack propagation was independent of crack length, specimen width and thickness.
8. The extrapolated values of COD appeared to vary linearly with a measure of the applied load as predicted.
9. An approximate analysis has been determined using elastic beam analysis couples with elastic geometric stress concentrations to estimate the local stresses in the material directly ahead of the tip of a crack immediately prior to crack propagation.
10. The local stress at the material directly ahead of the crack tip reaches magnitudes on the order of E/3 to E/10 at the time of crack propagation.
11. These estimates are only applicable to brittle materials with very limited (microscopic) plastic deformation at the crack at the time of propagation.
References
Gehlen, P. C., and Kanninen, M. F., (1985) An Atomic Model for Cleavage Crack Propagation in Alpha Iron, Battelle Memorial Laboratory Reports. Columbus OH.
Gilman, J. J. (1957) Nucleation of Dislocation Loops by Cracks in Crystals, Trans AIME April, pp 449.
Gilman, J. J., (1968) Dynamical Behavior of Dislocations, in Mechanical Behavior of Materials under Dynamic Loads, Lindholm, U. S., Ed., Springer Verlag, NY., pp. 152-175.
Gilman, J. J., Knudson C., and Walsh, W. P. (1958) Cleavage Cracks and Dislocations in LiF Crystals, J Applied Physics, Vol. 29, No. 4 April pp 601.
Griffith, A. A., (1921a) The Phenomena of Rupture and Flow in Solids, Phil. Trans. Roy. Soc. London, Vol. A 221, pp. 163-197. See also commentary by John J. Gilman, Metals Progress Series, pp. 861-906.
Griffith, A. A., (1921b) Stress Concentrations in Design and Practice. Rep. Brit. Ass., pp. 316-324.
Neuber, H., (1961) Theory of Stress Concentration for Shear-Strained Prismatical Bodies with Arbitrary Nonlinear Stress-Strain Law, Trans ASME , J. App. Mech., Dec. pp. 544-550.
Neuber, H., (1968) Kerbspannungslehre, Springer Verlag, Berlin.
Canine, M. F., Ahmed, J., and Leis, B. N., (1981) A COD-Based Fracture Mechanics Approach to the Short-Crack Problem in Fatigue, Mechanics of Fatigue SAME AMD, Vol. 47, pp. 81-90.
Packman, P. F., (1975) Interferometry Studies in Fracture, in "Experimental Techniques in Fracture Mechanics", Vol. II, A Kobayashi Edit. SESA, (Society for Experimental Stress Analysis) Monograph 1975.
Packman, P. F., and Steffen, A. A., (1987)An Optical Interferometry Technique to Evaluate Closure Along a Crack Front," Fatigue '87 - Proceedings from the 3rd International Conference on Fatigue and Fatigue Thresholds, Vol. 3, eds. R. O. Ritchie and E. A. Starke, Jr., EMAS Great Britain, Publishers, June, pp. 1469-1477.
Tillman, T. D., (1969) The Determination of the Crack Opening Displacement and the Theoretical Strength at the Tip of a Crack in Magnesium Oxide Single Crystals, Masters Thesis under the Direction of Dr. P. F. Packman, Vanderbilt University, Nashville TN.
Timoshenko, S., (1958) Strength of Materials, Part II, Third Ed., Van Nostrand Reinhold Co., NY.
Williams, M. L. and Swerdlow, J. J., (1967) The Association between COD Displacements and Fracture Toughness, Trans AIME, Vol. 239, pp 163.
Acknowledgements
A major portion of the experimental work was conduced by Thomas Tillman, under the direction of Dr. Packman in support of a Masters Thesis project for Mr. Tillman at
Vanderbilt University, Nashville TN. Additional experimental work was conducted by several graduate students under the direction of Dr. Packman at Southern Methodist University in Dallas TX. This paper represents a compilation of both experimental programs.
Photographs and Graphs
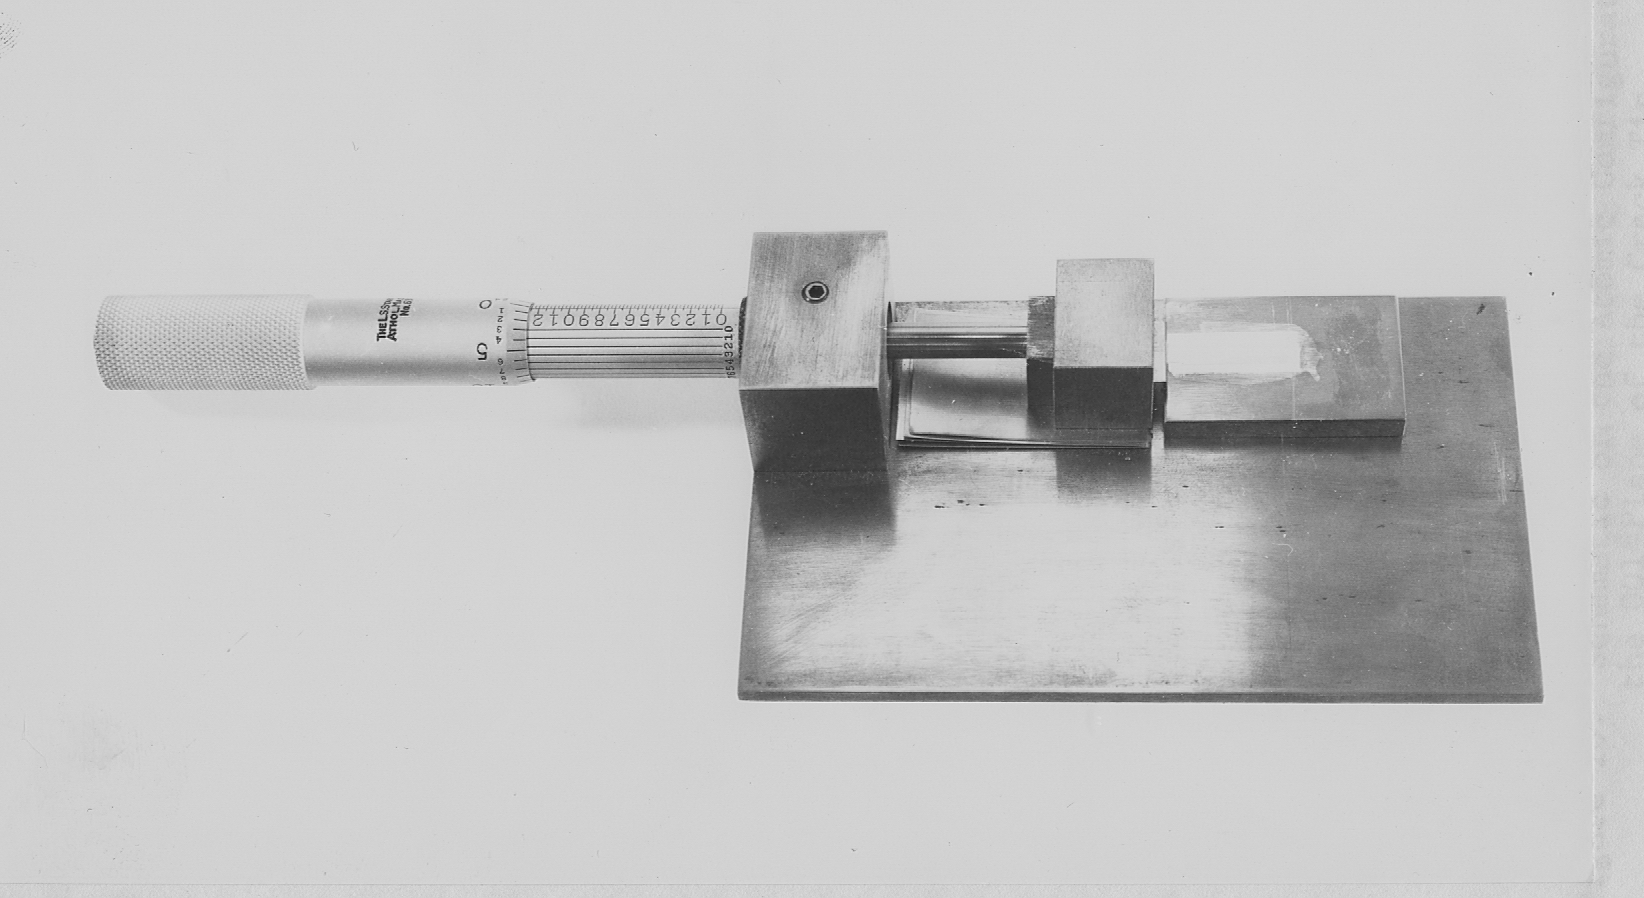
Figure 1. Cleavage Crack Loading Fixture

Figure 2. Photograph of Typical Cleavage Crack in MgO
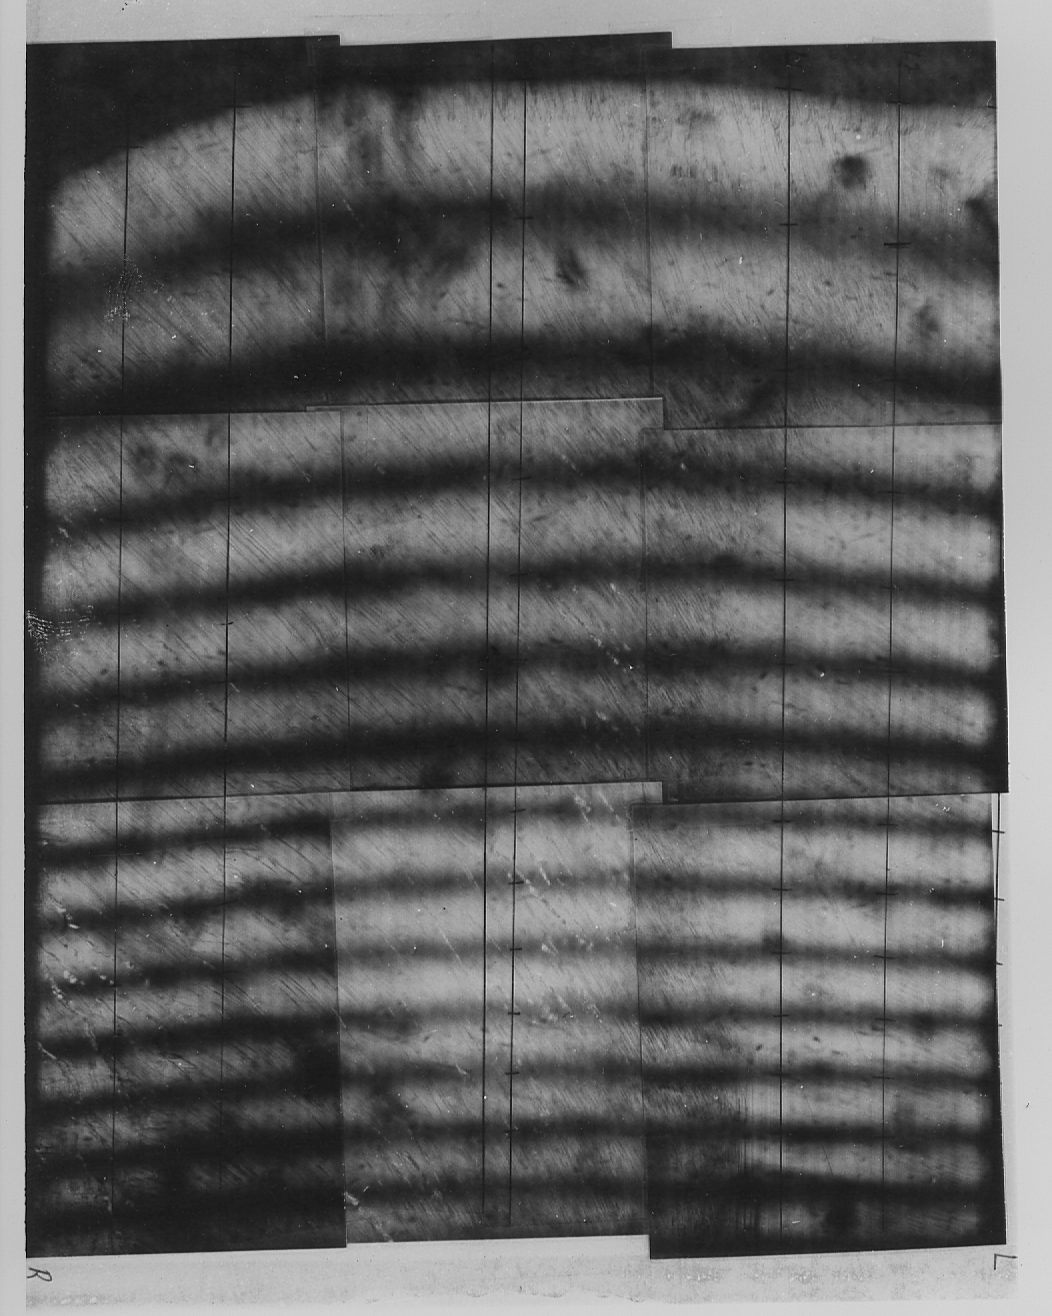
Figure 3. Typical Optical Interferometry Collage
Developed from Photographs of Crack Displacements
(Apron. 50X) Crack Tip is at the Top of the
Photograph

Figure 4. Graph of Fringe Order vs. Distance Back from Crack tip and superimposed third order polynomial fit to data showing Goodness of Fit R2

Figure 5. Optical Interference Collage of the Same Crack Loaded to Increasing Loads.

Figure 6 Graph Showing Effect of Increasing Load on Crack Profile.
Figure 7. Extrapolated Crack Tip Opening Displacement vs. Applied Load
(Fringe Order vs. Micrometer Readings)